10. Trending products, part 1: sales based models
Every online store has a “Trending now” shelf. Somebody built it in one sprint. Ask what “trending” means in that code and you get a shrug. This post opens it up. We take four simple models that use only past sales. We run them on the same fake data and watch them disagree.
Next week, part 2: we will talk about predictive models. These models predict trends before they happen.
[ TWO FAMILIES ]
Trending product - a product whose sales are growing faster than its own normal. Not the biggest seller. Not the newest. The one that is changing. A bestseller can sell the same amount every day and not be trending at all.
Trend tools fall into two families. This split is my own framing, not a standard.
- Reactive models score each product from its recent sales, then rank it. They are cheap, easy to explain and easy to ship. This post.
- Predictive models fit a curve to the sales and project it forward. They can tell a seasonal bump from a real climb. Part 2.
Many teams stay reactive on purpose. A 2025 study on Hepsiburada data found that recent sales beat all-time sales. A weekly-change method did best of all.
[ THE TEST DATA ]
All data here is fake. One seeded script made 120 days of daily sales for five products. Every number below comes from that one run.
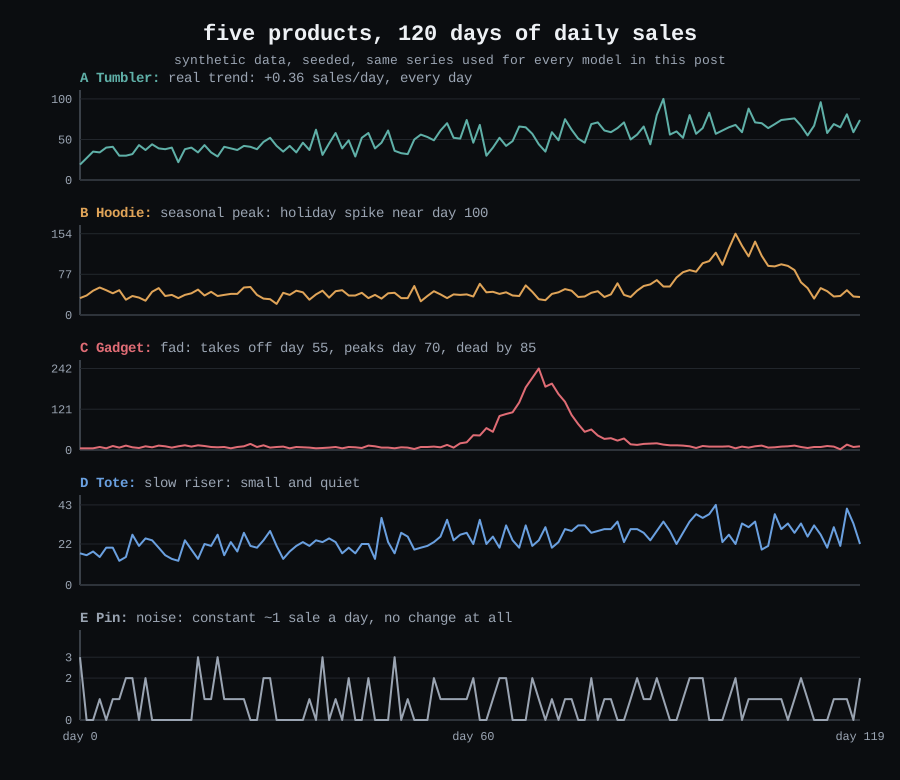
- A Tumbler is a real trend. It gains 0.36 sales every day. Its 7-day average grows from 32 to 72.
- B Hoodie is seasonal. It sells about 40 a day, then spikes near day 100 for the holidays.
- C Gadget is a fad. It takes off on day 55 and peaks at 242 sales on day 70. By day 85 it is back to about 15 a day.
- D Tote is small and quiet. It rises slowly.
- E Pin sells less than one a day. Its true rate never changes. It is here to cause trouble.
Here is the right answer. A is the only product to plan for. C gets a short flag, not deep stock. B gets flagged with a calendar next to it. E is never flagged.
[ MODEL 1: THE WINDOWED COUNT ]
This is the oldest trick. Add up the last N days and sort.
Here x(t) is the units sold on day t. With N = 7, the Gadget scores 1,103 on day 70. The Tumbler scores 374 and the Hoodie 286. It wins by a mile.
It is easy to explain and easy to write in SQL. It has two weak spots.
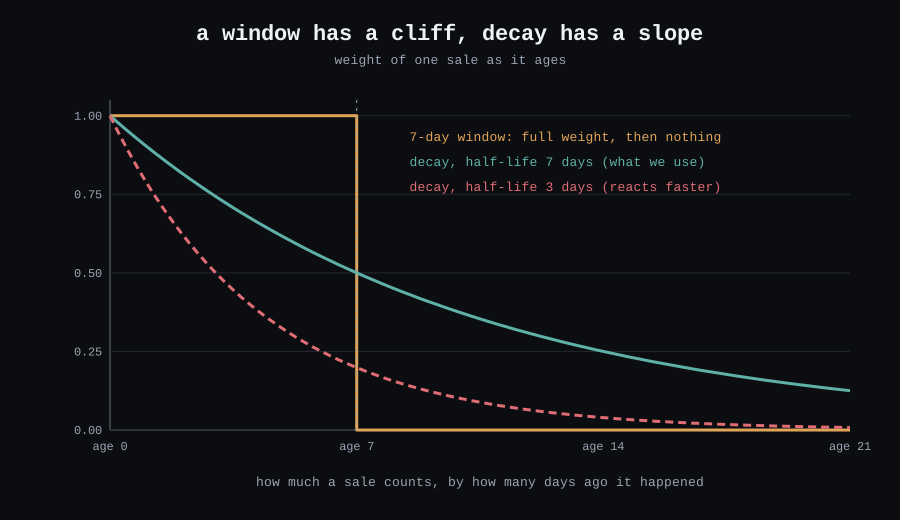
- The cliff. A sale from 6 days ago counts in full. A sale from 8 days ago counts for nothing.
- It measures size, not change. The Tumbler is in the top 2 on all 85 days. It is not trending. It is just big. Every “top sellers this week” list works like this.
[ MODEL 2: TIME DECAY ]
Let’s fix the cliff. Instead of a hard cut, let each sale fade as it gets older.
A sale that is a days old counts for e^(−λa) of a fresh sale. You pick the half-life. That is the age at which a sale counts half. With a half-life of 7 days, λ is 0.099. A sale from last week counts 0.5. A sale from two weeks ago counts 0.25. This is plain exponential decay.
You never need to scan old rows again. Keep one number per product and update it daily:
Take yesterday’s score and shrink it by 0.906. Then add today’s sales. This is an exponential moving average in disguise. On the Gadget’s climb:
| Day | Sales x(t) | S(t−1) × 0.906 | S(t) |
|---|---|---|---|
| 68 | 186 | 524 | 710 |
| 69 | 214 | 643 | 857 |
| 70 | 242 | 776 | 1,019 |
Or compute it from raw rows:
SELECT product_id,
       SUM(units * EXP(-LN(2) / 7.0 * DATEDIFF(day, sale_date, CURRENT_DATE))) AS score
FROM daily_sales
GROUP BY product_id
ORDER BY score DESC;
Big sites use the same idea. The commonly cited Hacker News formula divides points by (age + 2)^1.8. The old open-source Reddit code adds a time term to the log of the votes. This post compares several such formulas. For a live system, see this Redis tutorial.
Decay still ranks by size, so the Tumbler is still at the top. It has a second problem. On day 90 the Gadget sold only 119 units in 7 days. Its decay score is still 499, four times more. The big days fade slowly, so the dead fad stays on the shelf.
A window is a bouncer. You get in if you came this week. You stay out if you did not. Decay is a memory. Last week is a bit blurry. Last month is almost gone. Neither one asks if the crowd is growing.
[ MODEL 3: VELOCITY ]
Now we ask the right question. Is it rising? Compare the recent rate to the usual rate.
recent is the average daily sales over the last 7 days. baseline is the average over the 28 days before that. A velocity of 2 means “selling twice as fast as normal.”
Sellers say Amazon’s Movers & Shakers list works on rank change over 24 hours. Amazon does not publish the method, so take that as folklore.
The k matters a lot. Small numbers lie. Look at the Pin. Its true rate never changed. On day 60 it sold 9 units in a week. The 28 days before that averaged 0.6 a day. So the raw ratio is 2.12. It looks like a rocket. It was luck.
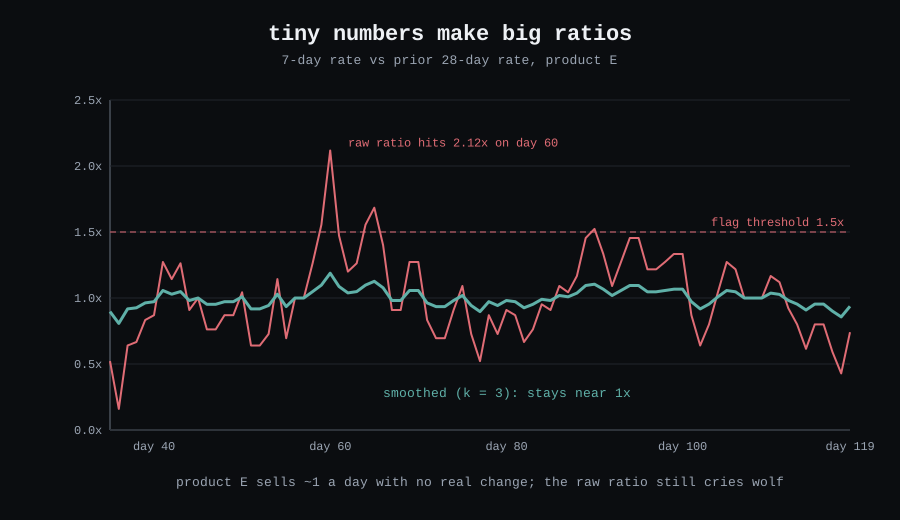
Add k = 3 to the top and the bottom. The same week now scores (1.29 + 3) / (0.61 + 3) = 1.19. That is no rocket. For big products, k barely matters. The Gadget on day 66 still scores 6.6. This is additive smoothing. A good k is “how many daily sales before I care.”
SELECT product_id,
       (AVG(CASE WHEN days_ago <= 7 THEN units END) + 3)
     / (AVG(CASE WHEN days_ago BETWEEN 8 AND 35 THEN units END) + 3) AS velocity
FROM daily_sales
GROUP BY product_id
HAVING velocity >= 1.5;
Velocity catches the Gadget on day 60, five days after take-off. But it has a blind spot. The Tumbler really is trending, yet its best velocity in 120 days is 1.33. Slow, steady growth looks like nothing when the baseline grows too.
[ MODEL 4: THE Z-SCORE ]
Velocity says how much bigger. The z-score says how surprising.
μ is the normal daily rate. 7μ is what one week should add up to. Counts like sales wobble by about the square root of their size. This is the Poisson rule of thumb. So √(7μ) is “one unit of normal wobble.” The z-score counts how many wobbles away you are.
Take the Gadget on day 60. It sold 127 units in 7 days. Normal is 8.2 a day, so we expect 57.5. One wobble is 7.6. So z = (127 − 57.5) / 7.6 = 9.2. A common alert line is z ≥ 3.
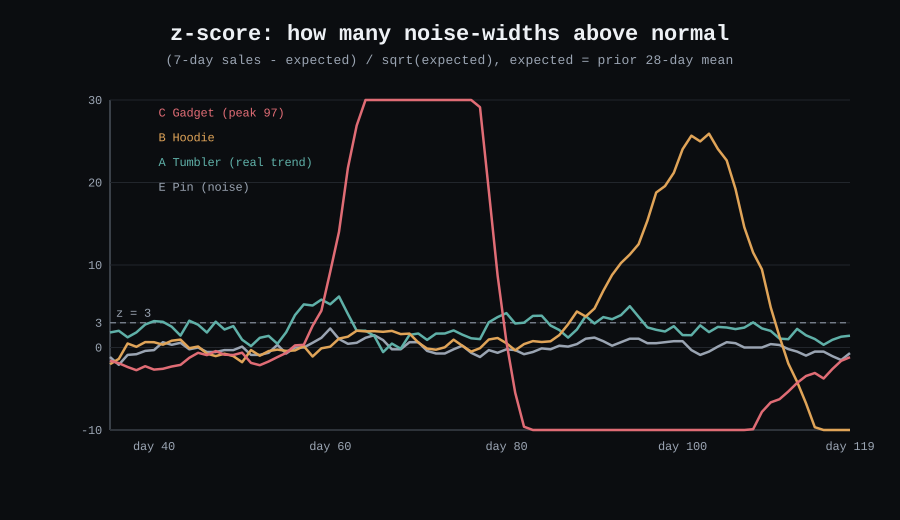
It needs no k, and the Pin never crosses 3. In a real catalog, compute μ per category too. Then one booming category does not flag every item in it.
The bad part is the wobble rule. It assumes pure Poisson noise. Real sales are lumpier. There are weekends, promos and viral posts. This extra spread has a name: overdispersion. In our data, the Tumbler’s daily spread is about 10. Poisson says 7. So the z-score flags the Tumbler on 24 of 85 days, mostly from noise. If you guess the wobble too low, you get false alarms. Measure it from history, or just raise the threshold.
[ HEAD TO HEAD ]
Now we run all four on the same data. “Flagged” means top 2 of 5 for window and decay, 1.5 or more for velocity, and 3 or more for z.
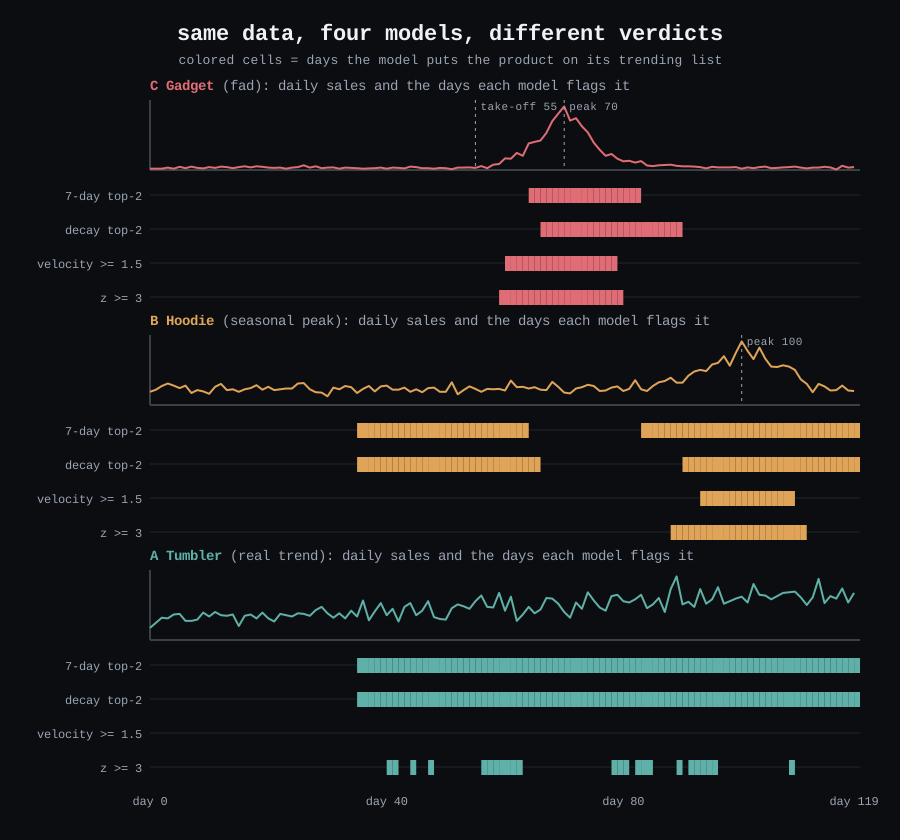
First, the Gadget fad. It took off on day 55 and peaked on day 70.
| Model | First flagged | Last flagged | Verdict |
|---|---|---|---|
| z ≥ 3 | day 59 | day 79 | fastest in, fast out |
| Velocity ≥ 1.5 | day 60 | day 78 | fast in, fast out |
| 7-day window | day 64 | day 82 | 9 days late |
| Decay | day 66 | day 89 | 11 days late, 19 days after the peak |
The change-based models win on timing. The size-based ones wait until the fad is big. Then they keep it on the shelf after it is dead.
Now the other two products:
- Hoodie (seasonal). Velocity flags it on days 93 to 108. The z-score flags it on days 88 to 110. Both fire as the holiday climb starts. That is correct, but not useful. Nothing tells the model this spike comes back every year.
- Tumbler (real trend). The window and decay models rank it top 2 on all 85 days. Velocity never flags it. The z-score flags it on and off for 24 days, mostly from noise.
[ WHAT ALL FOUR CAN’T DO ]
Here is the awkward result. The Gadget fad and the Hoodie spike look the same to all four models while they rise. The Tumbler is the one product that really grew. Its sales doubled. It gets a permanent bestseller badge or no flag at all.
Reactive models only describe the past. They cannot say if a rise will last. Two lessons follow:
- Use size models and change models for different shelves. Use window or decay for “popular right now.” Use velocity or z for “rising fast.” Do not mix them in one list and call it trending.
- Never act on one signal. I keep a rule in my notes: wait for three signals to agree before you buy stock. A fast flag from velocity plus a search or social signal is a lead. It is not a decision.
Part 2 looks ahead, so we can finally ask what these four cannot.
[ ELSEWHERE ]
GitHub · LinkedIn · Dev.to · Substack · 4thwithme.dev/blog
May the --force be with you. See you next week.