9. Synthetic customers, part 2: a field guide to fake shoppers you can trust
Part 1 covered the theory. This part is a field guide. It shows how to build synthetic customers without LLMs (large language models), what can go wrong, and what worked for us.
A note first. The real data is not mine to share. So the example store is made up. It sells colored and flavored toilet paper: mint, lavender, bacon, glitter. Every number is invented. The method is real.
[ THE GOAL ]
Say your store has a “similar products” widget. A new version is ready. You want to know if it is better before real customers see it.
A synthetic customer helps. It stands for a group of real customers. You show it a list of products. For each product, it returns the odds of a click, a save, an add to cart, and an order. In part 1 terms, this is the meso scale: one model per group.
There are seven steps. Each has three parts: what to try, what can go wrong, and what worked for us.
[ STEP 1: KNOW YOUR CUSTOMERS ]
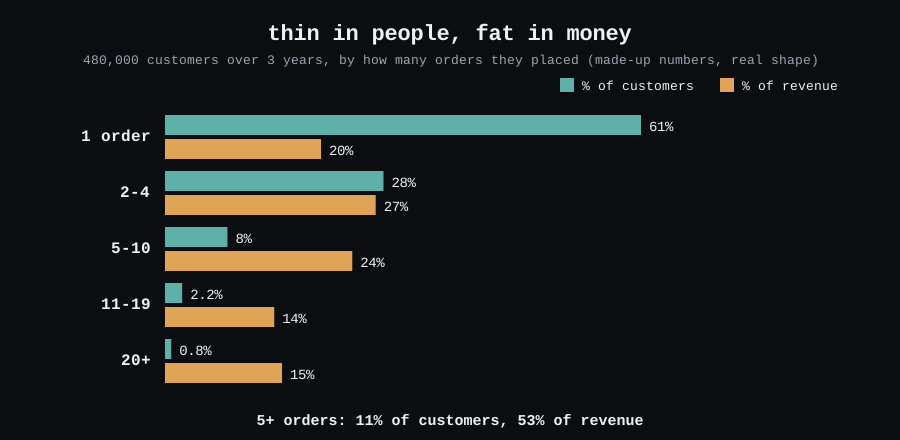
What to try. Count orders and revenue per customer. Look at the shape.
Pitfalls.
- Most customers bought once. A few heavy buyers carry the revenue. An average hides both.
- Divide orders by time as a customer, and a new customer with 3 orders in 5 weeks looks like a heavy buyer. Set a minimum of one year first.
What worked for us. We weight results two ways: by number of customers and by revenue. We always report both. We use the one-year minimum.
[ STEP 2: GROUP THEM ]
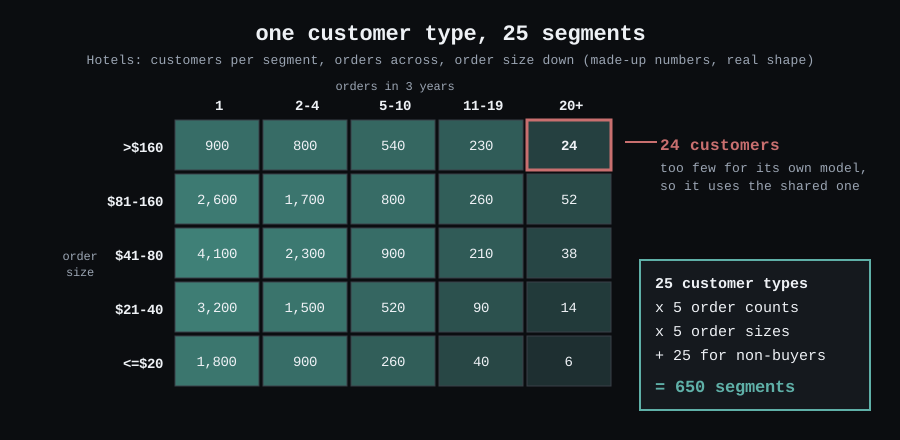
What to try. Three options. One model per person. Clustering on many traits. Or a fixed grid on a few simple traits: who they are, how often they buy, how much they spend.
Pitfalls.
- One model per person has too little data.
- Clusters are hard to name. They can also shift each time you refit.
- Too many groups leave some with a handful of customers. Merging them hides your heaviest buyers.
What worked for us. A plain grid. There are 25 customer types, 5 order counts, and 5 order sizes. That is 625 segments. We add 25 for people who have not ordered. Each segment has a readable code, like Hotels_5-10_41-80. We kept thin segments. They lean on a shared model.
[ STEP 3: BUILD THE TRAINING DATA ]
What to try. Use one row per product shown to one customer in one list. Add the product’s category, price, and brand. Add the position, the device, and the list length. Label each row yes or no for click, save, cart, and order.
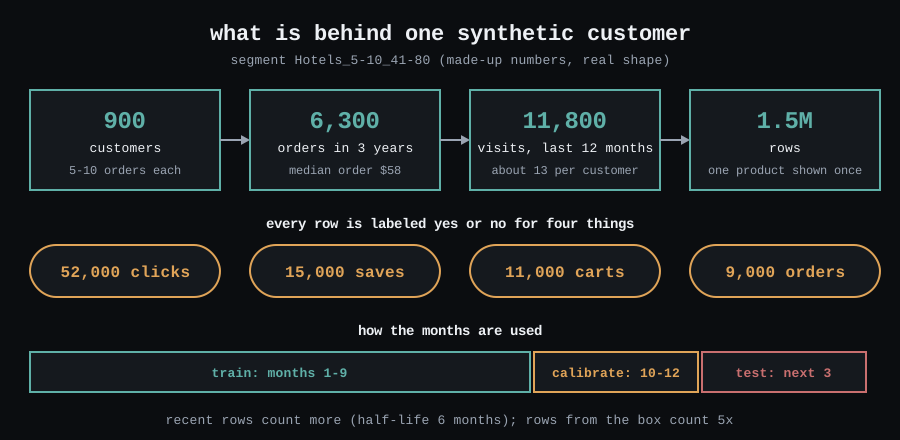
Orders give the customer its taste: which scents and sizes it buys. Rows give the yes and the no. A model needs both.
Pitfalls.
- Keep all clicks and only some non-clicks, and the model learns that everyone clicks. Predicted rates come out several times too high.
- Split by time, not at random. Random splits leak the future.
- Logs often do not say which products were shown. Rebuild each list with the live system’s rule, and say so.
- Tracking changes can shift your rates overnight. Plot raw counts per day before you trust a model.
- Skipped products must look like what the system could really show. Otherwise the model learns the wrong lesson.
What worked for us. We train on 9 months, calibrate on 3, and test on the next 3. Recent rows count more. Rows from the widget count 5 times more.
[ STEP 4: PICK A MODEL ]
What to try. One model per segment. One shared model. Or both. Always add a baseline that ranks by position only.
Pitfalls.
- Position is the strongest signal. If you do not beat the baseline, you built nothing.
- Own models overfit small segments. A fancier library does not fix thin data.
What worked for us. Both. A segment with enough clicks uses its own model. A thin one uses the shared model. Both are gradient-boosted trees.
[ STEP 5: FIX THE LEVELS ]
What to try. Calibrate. Shift the odds until the average matches the real rate. Do it per position band.
Pitfalls.
- Calibrate on one unusual month and you overshoot. Use several months. Test on months the model never saw.
- Calibration never changes the ranking. It only fixes the level.
- Raw rates drift with the season. Report the gain over the current version, not raw rates.
What worked for us. Three months, per position band. After that, rates land within about 10% of real.
[ STEP 6: GRADE EACH SYNTHETIC CUSTOMER ]
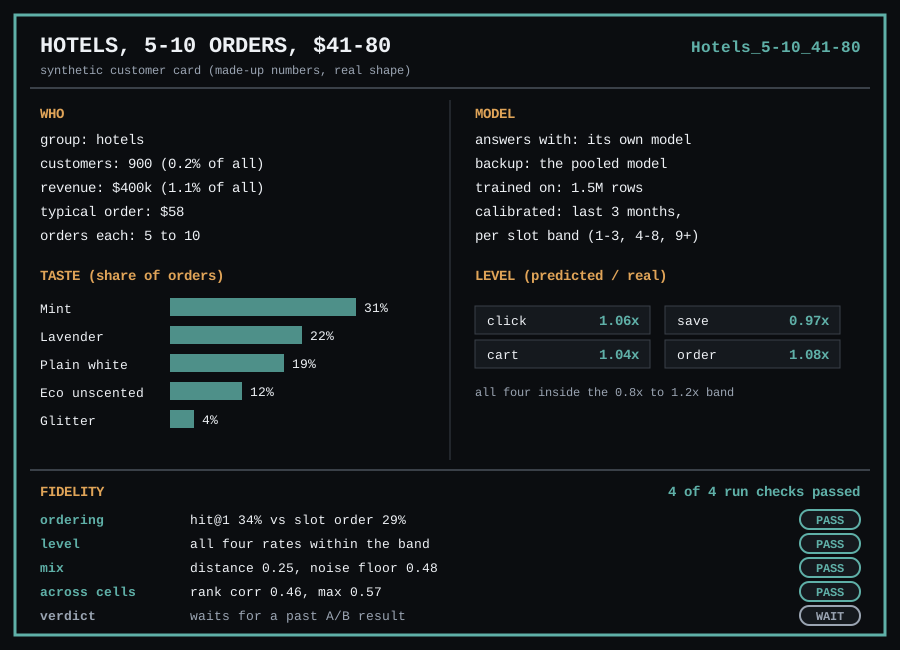
What to try. One number is not enough. Use five checks and put them on a card.
- Ordering. Does it rank the clicked product first? We call this hit@1.
- Level. Is the predicted rate close to the real rate?
- Mix. Does it favor the same kinds of products as real customers?
- Across segments. Does it rank segments the way reality does?
- Verdict. Does it pick the same winner as a past A/B test?
Pitfalls.
- A threshold tighter than real-world noise fails everyone. Measure the noise first. Split the real clicks into two random halves. See how far apart they are. A synthetic customer closer to reality than the halves are to each other is as good as the data allows.
- A customer can rank well and still click far too often. Check level and ranking separately.
- The verdict is the strongest check. Many teams skip it.
What worked for us. If a customer fails two checks, it does not vote. About 3 in 10 segments fail, mostly thin ones. Our verdict check still waits for a past A/B result.
[ STEP 7: USE THEM ]
You can estimate three things.
Read one list
Show a synthetic customer a list. It scores each product. It also says why.
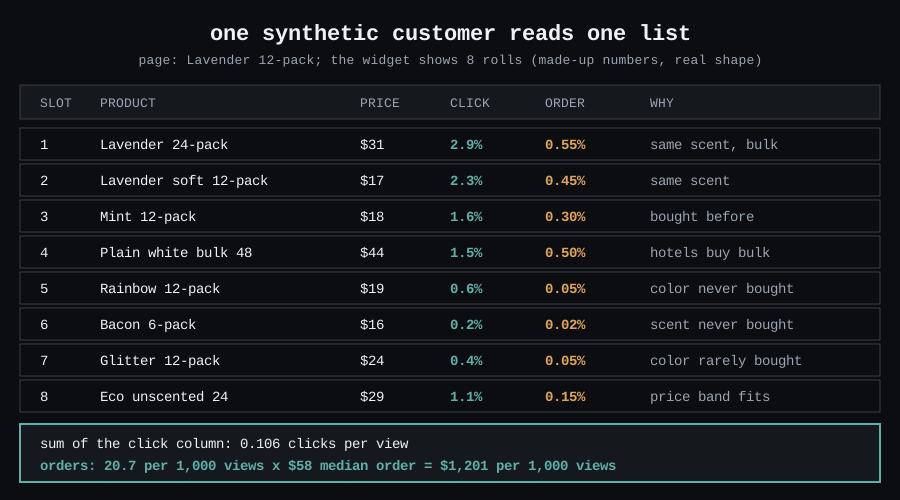
Here, hotels favor lavender and a bulk pack. The click odds add up to 0.106 clicks per view. The order odds add up to 20.7 orders per 1,000 views. At the segment’s $58 median order, that is $1,201 per 1,000 views.
To find a reason, set each input to “unknown”, one at a time. The inputs that move the odds most are the reasons.
Compare two versions of a recommender
Run every synthetic customer on the same pages, for each version. Then add up the answers with weights.
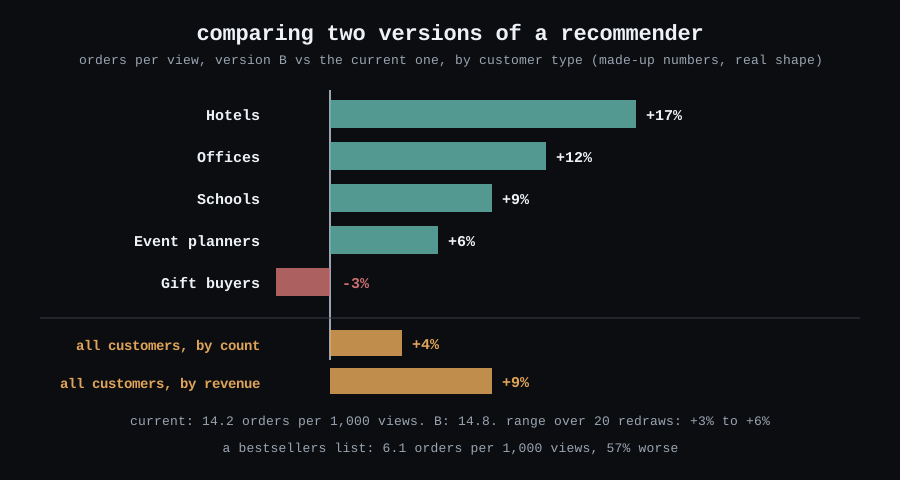
Version B gains 4% by customer count and 9% by revenue. Hotels gain 17%. Gift buyers lose 3%. One average number hides that. Always look by group.
Pitfalls.
- Score each list in the context of its page. If the evaluator only asks “does this customer like this product?”, popular items always win.
- Do not let the baseline and the evaluator share logic. Otherwise the baseline looks better than it is.
- Do not estimate “chance of no click” by multiplying independent odds. Real clicks come in bunches.
- Report a range. Redraw the page set 20 times. A gain that flips sign is noise, not a win.
What worked for us. Adding the page’s product to the evaluator. And reporting gain by group, not one number.
Try a new product
You need no history. The models read traits like scent family, price, and brand. They do not read product IDs. Put the new product in a list and ask who clicks it.
In the example, event planners click it 31 times per 1,000 views. Hotels click it 6 times. So show it where party buyers browse. This is the what-if part (C2) from part 1. The same trick works for a price change.
[ WHAT IS STILL OPEN ]
Run the verdict check on two versions that were really live. Until then, the numbers are plausible, not validated.
Here is how I plan to use it. Replay two past versions and check the verdict. Screen every new candidate before an A/B test. Send only the winners to a live test. It will not replace A/B tests. It will cut the number of weak ideas that reach them.
Part 1 asked: does the fake shopper act like the real one? My answer is “partly”. The ranking is believable. The levels can be calibrated. I know which segments to distrust.
[ REFERENCES ]
- Stavinova et al. Synthetic Data-Based Simulators for Recommender Systems: A Survey. 2022.
- Bougie, Watanabe. SimUSER. 2025. arXiv:2504.12722
- Part 1 has the rest.
[ ELSEWHERE ]
GitHub · LinkedIn · Dev.to · Substack · 4thwithme.dev/blog
May the --force be with you. See you next week.