13. Measuring performance, part 2: EM, PM, designer and the C-level
The higher the role, the less of the output is your own. How to rate EMs, PMs, designers and the C-level.
Performance review is a hard problem. Every company does it in a different way. Part 1 looked at the developer. This post looks at roles that do not write code. These are EMs, PMs, designers and the C-level. For each role, we ask what the approaches measure.
One rule runs through this post. The higher the role, the less of the output is your own. So we rate leaders on two things. First, the results of the people around them. Second, the systems they built to get those results.
A second rule runs through it too. Numbers and charts come first. Opinions explain them. An opinion without a number is a guess. A number without a story is noise. A good review needs both, in that order. Leaders work through other people, so their reviews drift to opinion fastest. That is exactly why they need numbers most.
[ SAME STEPS, DIFFERENT CONTENT ]
The steps of a review stay the same for every role. Only the content of each step changes.
| Step | What happens | Same for all roles? |
|---|---|---|
| 1. Expectations | A written ladder per level, shared before the cycle | Yes, but each role has its own ladder |
| 2. Goals | 1 to 3 focus areas plus result goals | Yes |
| 3. Evidence | Self, peer and upward reviews, plus real work | The mix changes |
| 4. Rating | One rating against the ladder | Yes |
| 5. Calibration | Managers compare ratings to keep them fair | Yes |
| 6. Talk | Written review sent early, money discussed apart | Yes |
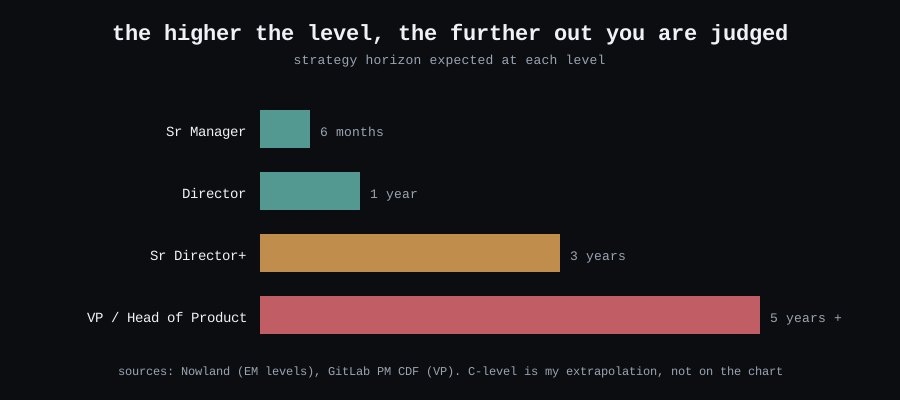
The time horizon does change. Leaders are judged on how far ahead they plan.
[ ENGINEERING MANAGERS ]
The best EM rubric I found is by Ian Nowland. Nowland uses seven areas for every manager level. It works from first-line manager up to VP. The “people” area splits into three. So in practice you rate nine boxes.
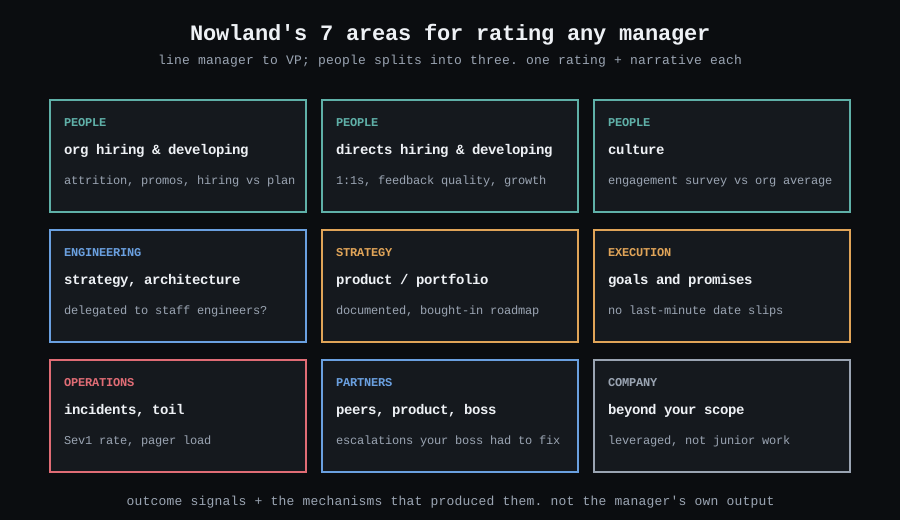
Two parts of the template surprised me.
The review starts with raw data. First come the team survey scores, next to the company average. Then come quotes from peers and direct reports. They are copied word for word. Names are removed, but nothing is rewritten. Nowland’s reason is simple. Hearing feedback you disagree with is a core leader skill. Nowland only does this for people with 5+ years of experience. Juniors often take raw feedback too personally.
The team survey is the most objective signal. It has bias. Still, it is the closest thing to a measurement in an EM review. It is the “data from humans” idea from part 1, one level up.
Each area then gets a rating and a short story. The signals come in two types:
| Type | EM signals | Why it matters |
|---|---|---|
| Result | Attrition, promotions, hiring vs plan, survey scores, delivery, serious incidents, escalations | This is the outcome. Judge it, but consider what they inherited |
| System | Regular 1:1s, staff engineers own the design, written strategy, early risk warnings, team rituals | The manager controls these. Growth plans focus here |
Some of the examples are worth copying:
- A director misses dates. Missing one date is fine. Missing dates on many teams, many times, with no warning is not.
- A director has great peer relationships. Nowland still warns them. Personal ties do not scale as the company grows. They need to build systems instead.
- A strong player-coach owns the tech vision. That gets a lower rating. They should grow a staff engineer to own it.
The EM’s code review, in numbers
Most EMs still touch code. They rarely ship much of it. They review it. Review is where an EM’s technical work turns into a system. Fast reviews unblock people. Wide reviews spread context across teams. Clear reviews teach.
So don’t count an EM’s merged PRs. A high PR count for an EM is often the hero player-coach from the list above. Count how they help other people ship.
The screenshots below come from ShowOffer (https://showoffer.tech). It reads GitHub activity and turns it into widgets like these.
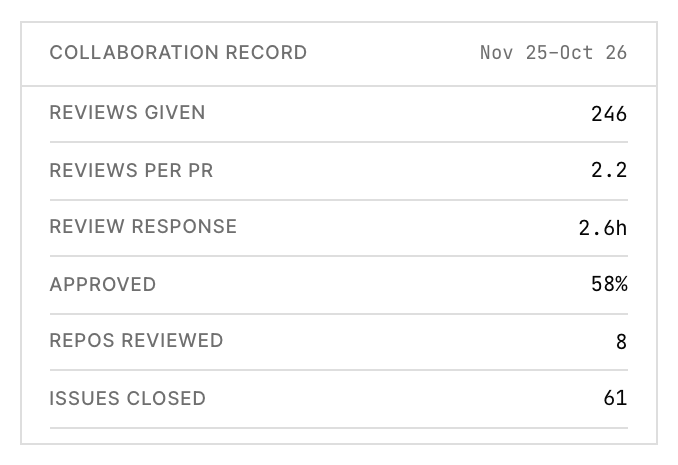
Each line answers a question from Nowland’s areas:
| Number | Question it answers |
|---|---|
| Reviews given | Does the EM still read the team’s code? |
| Review response | Do people wait for the EM? |
| Approved share | Does the EM block, or teach and trust? |
| Repos reviewed | Does the EM know the whole system, or one corner? |
Then look at speed. Speed is the part the team feels.

Review response fell from 4.2 to 2.6 hours. That is 38% faster. Now the review has a fact, not a feeling. “The EM is more available” becomes “people wait 1.6 hours less for the EM.” You can check it again next cycle.
Last, look at where the reviews go.
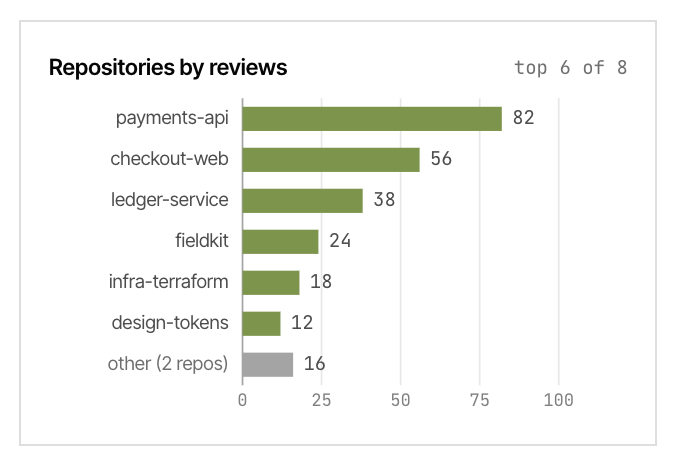
This chart starts a good talk. One repo gets a third of all reviews. Is the EM the only person who can approve payments code? Then that is a bus factor of one, not a strength. A good EM goal follows from it: “Grow two reviewers for payments-api this half.” It is one system, and the next chart will show if it worked.
These numbers do not replace the team survey or the raw feedback. They sit next to them. When the survey says “the EM is hard to reach” and review response says 2.6 hours, you have a real question. Ask it.
The rating scale
Nowland rates each area on four steps. Top is 10%. Exceeds is 30%. Achieves is 50%. Needs improvement is 10%. Read this with care. It helps you set your own bar for the level. It is not a quota.
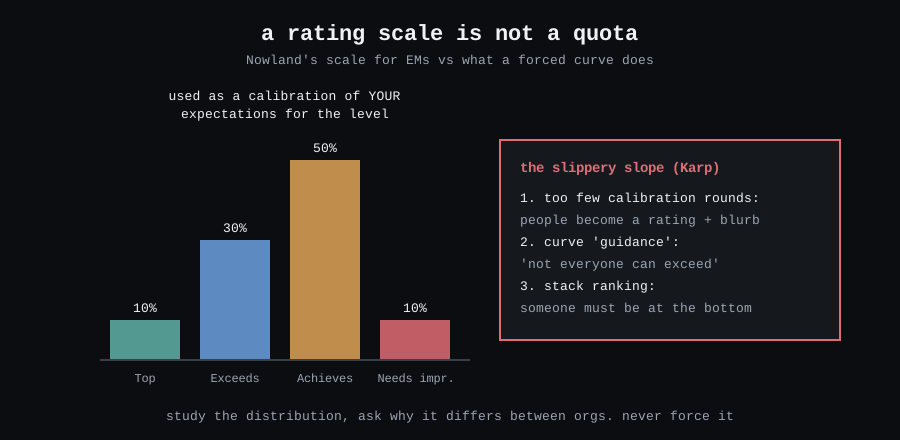
Alex Karp describes the slide on LeadDev. It has three steps:
- To save time, the company holds fewer calibration rounds. People shrink to a rating and one sentence.
- A curve shows up as “guidance”. The message becomes: not everyone can exceed.
- Someone must be at the bottom. This happens even when everyone meets the bar.
The harm hits hardest those least able to push back.
EM goals
Good EM goals turn each weak area into one concrete system. A wish is not a goal. Some examples:
- Culture: “Start one regular team ritual this half. Fortnightly demos would work.”
- Delivery: “Meet the TPM weekly. Flag date risks weeks ahead.”
- Engineering: “A staff engineer owns design X. I step back from design reviews.”
- Partners: “Fix issues directly before I escalate. Ask my top 3 partners for feedback quarterly.”
The manager controls each one. Each one is easy to check at the next review.
[ PRODUCT MANAGERS ]
PMs face the same problem in another form. They own few things you can point at. Product results depend on many things outside their control. So reviews drift toward “what did the engineers say?” Reforge names three common mistakes:
- Rating the result instead of its root cause.
- Giving one single rating for everything.
- Giving feedback only at review time.
Their fix is Ravi Mehta’s skill model. It has 4 areas with 3 skills each.
| Area | Skills |
|---|---|
| Product execution | Writing specs · delivery · product quality |
| Customer insight | Using data · voice of the customer · UX design |
| Product strategy | Owning business results · vision and roadmap · strategic impact |
| Influencing people | Stakeholders · team leadership · managing up |
Mehta is honest about this model. Most PMs excel at only a few of the twelve skills. Even great PMs do. So don’t ask “is this person good at everything?” Find their strengths. Then pick where they should grow.
The main focus of a PM review shifts with level:
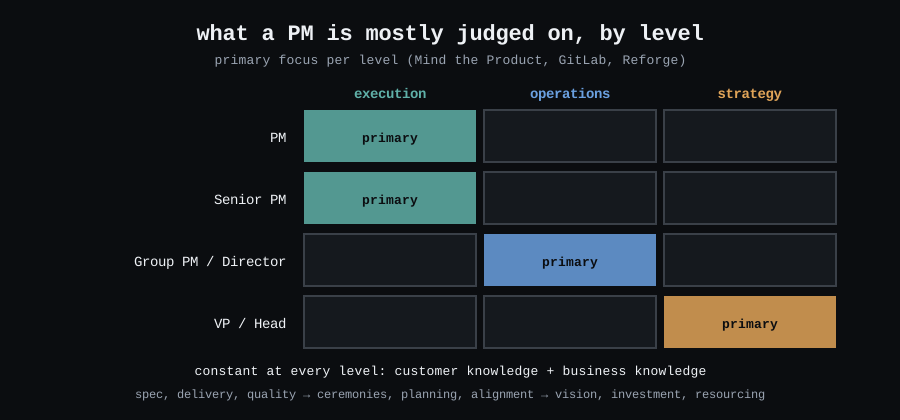
GitLab’s version, with numbers
GitLab’s PM framework is public and very concrete. It has four skills. They are roadmap and growth, sensing the market, thought leadership, and aligning teams. Each skill has example KPIs. Examples are monthly active users, say/do ratio and cycle time.
I took two ideas from it:
- Each review ends with 1 to 3 focus areas. You check them in every 1:1. They also give you a reason to say no to other work.
- OKR results have a sweet spot.
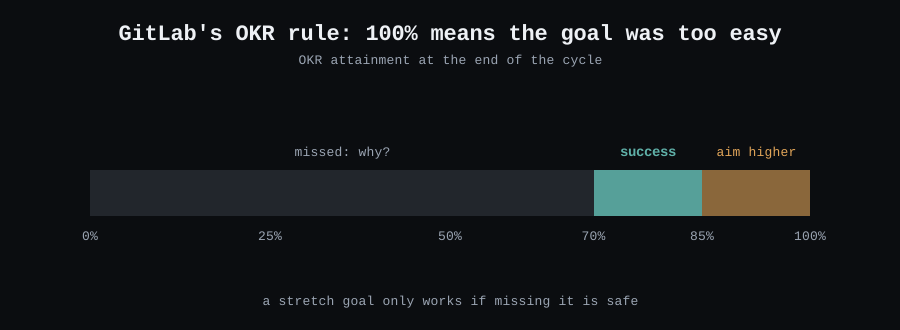
This only works if missing a stretch goal is safe. Say 80% counts as “missed 20%” in a review. Then people will set goals they can hit fully.
The PM review
Mind the Product shares a case I have seen myself. A PM rated themselves “exceeds expectations”. Their manager rated them “fails to meet”. Both were honest. The cause was late feedback. The fix is boring. Hold weekly 1:1s. Do a 5-minute debrief after key calls.
Product Breaks suggests three ways for PMs to measure themselves:
- Reflect regularly. Write down what went well and what blocked you.
- Get feedback from many people. Include PMs outside your company.
- Check your impact. Did the team ship something for customers, the business and the team?
[ DESIGNERS ]
Design is the hardest of the three. Sales has close rate. Engineering has cycle time. Support has response time. Design has no clean metric. Its impact rides on product numbers. Those numbers depend on choices the designer does not make.
So many teams count screens or rate how pretty the work is. Both are wrong. Uxcel names the main bias: polish over impact. “The design is done” often means a pretty screen. Behind it are unsolved logic and no success metric.
Uxcel splits the review into effort and impact. It defines both:
Effort is how much clarity the designer creates. Signs: full thinking before pixels, good timing, work ready to build, and testing.
Impact is delivery, then reliability, then adoption. You define it before work starts.
The right depth depends on the work. Uxcel uses three classes:
- Class 1 is small fixes and UI tweaks. Speed matters most. A design doc is just paperwork.
- Class 2 is standard features.
- Class 3 is unknown problems and discovery. Deep testing is worth it here.
Expect the same depth everywhere, and you reward people who look careful. You should reward people who are right.
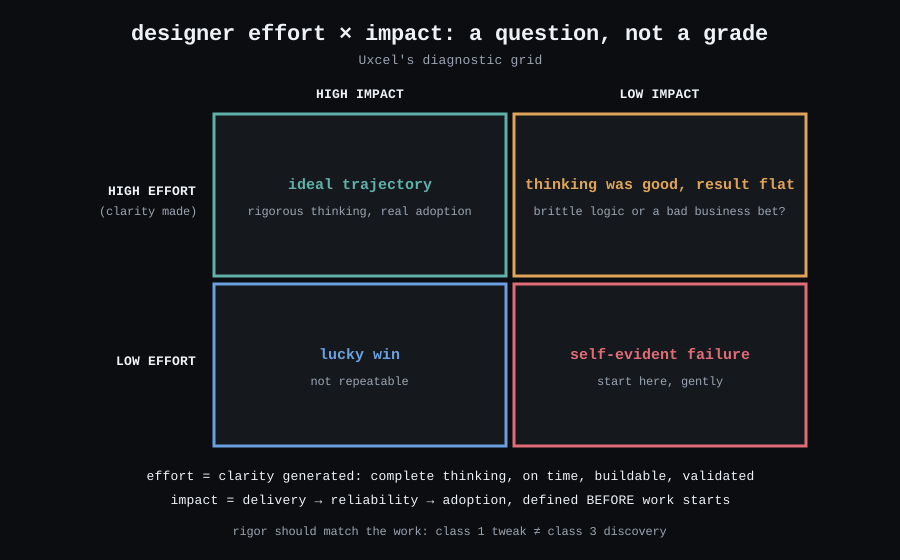
The top-right box is the interesting one. The thinking was good, but the result was flat. Uxcel’s rule is clear. If the design choice failed, the designer owns it. If the business bet failed, the team shares it. That is fair. It also makes everyone check the logic early.
Now the ladder itself. Figma cut seven vague areas to four. They are strategy, craft, collaboration and impact. Twilio cut 19 categories to 5. Intercom removed lines like “be seen as an expert”. The designer cannot control recognition. Also, it is given out unequally. So write expectations as actions.
For designer goals, pick one skill to grow every six months. For example, move “problem definition” from L2 to L3 level. Add one project goal too. Agree its impact metric with the PM at kickoff.
[ THE C-LEVEL ]
I must be honest here. None of my 30 sources has a rubric for a CTO or CPO. Nowland stops at VP. GitLab’s VP column is mostly empty. So this section is my own extension of the patterns above. Treat it as opinion.
The pattern is clear. With each step up, less of the output is your own. The horizon gets longer. The rating depends more on team results and on the systems behind them. At the top, the system is how the company runs. That means planning, the ladder, reviews and the hiring bar.
So for a C-level tech leader, I would track three metric groups. The framing comes from Rob Zuber’s LeadDev piece on goals:
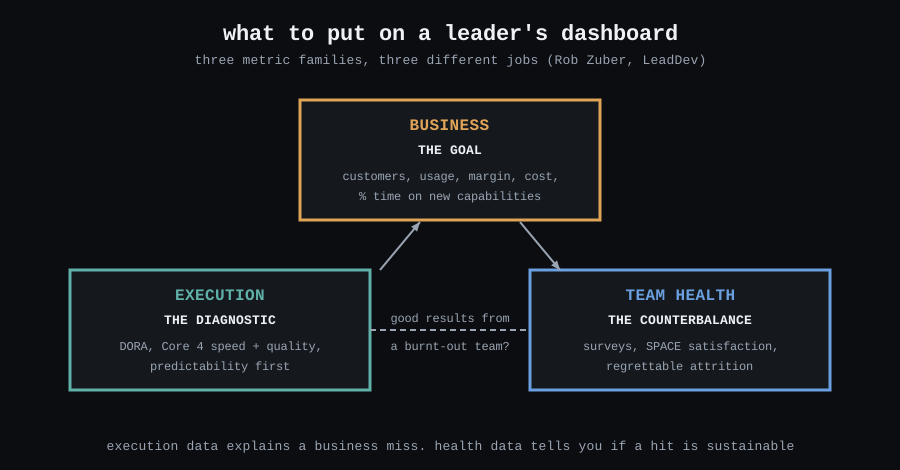
- Business is the goal. These are the numbers the board cares about. DX Core 4’s “impact” area fits here. One example is the share of time on new features. Others are R&D cost per revenue and revenue per engineer. DX says to use the last two at company level only. For a C-level leader, that is the right level.
- Delivery is the diagnostic. Use DORA and Core 4 speed and quality across all teams. Do not set them as targets. Look at them when a business number slips. Start with predictability.
- Team health is the balance. Use developer surveys, regretted attrition and team survey scores. A great year with a burnt-out team is a loan, not a result.
The rest comes from Nowland’s areas, with a 3-year horizon. Ask three questions. Is the strategy written down, and do peers use it? Does the org solve its own escalations? Is the leader’s time spent on work only they can do?
C-level goals follow the EM rule. Fix each weak area with one system. One example: “Start a yearly planning cycle with a written strategy per org.” Another: “Run a developer survey twice a year. Share one action after each.” The goal is a company that works without the leader in the room.
[ CALIBRATION, FOR EVERY ROLE ]
All these ratings meet in one room. Will Larson gives four rules for that room:
- Search for fairness together. It is not a debate to win.
- Read, don’t pitch. If managers pitch their people, the best speaker wins.
- Compare to the ladder, not to each other.
- Study the spread of ratings, but don’t force it. Does one org have twice as many “exceeds”? Ask why. Don’t just cut them.
“Read, don’t pitch” is where numbers matter most. A pitch is an opinion with good delivery. A chart is the same for every speaker. So bring the evidence on one page, this period next to the last one (https://showoffer.tech).
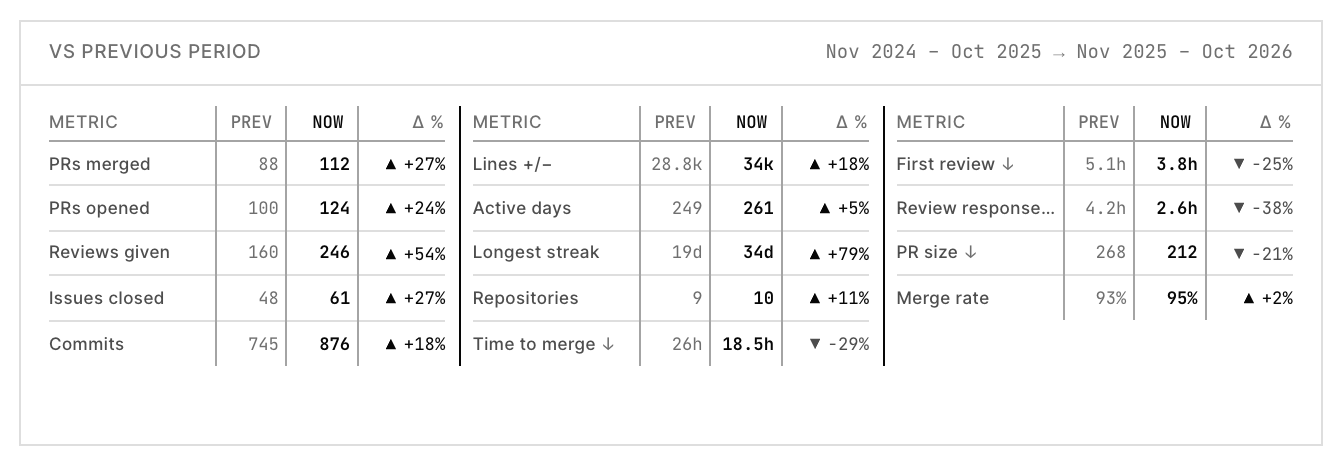
Pick the rows that match the person’s ladder. For an EM, read the review rows, not the PR rows. Then the talk in the room is about what the numbers mean. It is not about who tells the best story.
Karp adds practical fixes. Calibrate in small groups first, where people know the work. Discuss everyone, not only edge cases. Define each rating precisely. “Exceeds some” needs a number for “some”. After the cycle, check ratings and promotions by group. You only see bias when you look for it.
[ CHEAT SHEET ]
| EM | PM | Designer | C-level | |
|---|---|---|---|---|
| Ladder | Nowland’s 7 areas | Mehta’s 12 skills, GitLab’s 4 | Strategy, craft, collaboration, impact | Nowland’s areas at 3+ years (my view) |
| Main evidence | Team survey, raw feedback, retention, delivery, review speed and spread | Results vs goals, partner feedback | Design docs, testing, adoption | Business results, team health, strategy use |
| Impact means | Team results and the systems behind them | Product numbers they moved | Delivery, reliability, adoption | How well the company runs |
| Goals | One system per weak area | 1 to 3 focus areas, OKRs at 70 to 85% | One skill per 6 months, plus project impact | Systems that work without them |
| Common bias | Rewarding hero player-coaches | Trusting peer opinion too much | Polish over impact | Rating the market, not the leader |
[ THE SMALL PRINT ]
This post uses public handbooks and blog posts, not research studies. The rating percentages, OKR bands and horizons come from specific companies and authors. They are not universal rules. The C-level section is my own view, and I marked it. Jordan Vale and every number in the ShowOffer figures are made up. They come from its sample data. I built ShowOffer, so I’m not neutral about it. The method works without it: GitHub search or your own dashboards will do. Do you know a good public rubric for a CTO or CPO? Please send it to me. I could not find one.
[ ELSEWHERE ]
GitHub · LinkedIn · Dev.to · Substack · 4thwithme.dev/blog
May the --force be with you. See you next week.