5. A/B testing: how to test your test
Posts 3 and 4 were about the math: what “significant” actually means, and which test design fits which situation. This one is about a question that comes before either: how do you know the test itself is working? A p-value can be perfectly correct and still be answering a question corrupted by a tracking bug, a broken randomizer, or a confound nobody looked for. Here’s how to check.
[ A/A TESTS ]
A/A test - run two completely identical experiences against each other and check whether your pipeline reports a difference. There shouldn't be one. If it finds one anyway, the problem isn't your product, it's your testing setup.
It’s the cheapest validity check available and it’s underused precisely because it feels like it can’t fail - you’re testing nothing against nothing, what’s there to break? Plenty. Randomization bugs, tracking that double-fires for one arm, IDs that leak between groups: none of that shows up until you look. Microsoft’s experimentation team documented a platform where repeated A/A tests turned up a false-positive rate as high as 30%, against a nominal 5% - the stats engine itself was miscalibrated, and no amount of correct math downstream would have caught that. The fix isn’t a one-time check before launch, it’s continuous: route any traffic that isn’t allocated to a real test into a standing A/A test, so a regression in the pipeline shows up before it corrupts something you actually care about.
In plain words: two vending machines, stocked with the exact same snacks at the exact same prices. If your sales dashboard tells you machine B is suddenly selling 20% more candy than machine A, the candy isn’t the story - one of the machines is broken, or someone’s miscounting the coins.
[ SAMPLE RATIO MISMATCH ]
Sample ratio mismatch (SRM) - you configured a 50/50 split, but the traffic that actually landed in each group isn't 50/50. A chi-squared goodness-of-fit test on the observed counts tells you whether that gap is noise or a real problem.
The industry convention here is a much stricter bar than the usual 5%: teams flag SRM at p < 0.001, deliberately tighter, because at real traffic volumes even a trivial imbalance clears 0.05 easily, and you’d rather tolerate a few false alarms than miss a broken splitter. Here’s what that looks like with actual numbers: 100,000 visitors, intended 50/50, and you actually get 52,000 in control against 48,000 in test. Run the chi-squared test on that and you get χ² = 160, which lands around p ≈ 10⁻³⁶ - not a borderline call, a five-sigma-and-then-some alarm bell. That kind of gap is almost never real randomness; it’s bot traffic skewed into one arm, an ID collision, or a redirect that leaks users out of their assigned bucket before they’re logged.
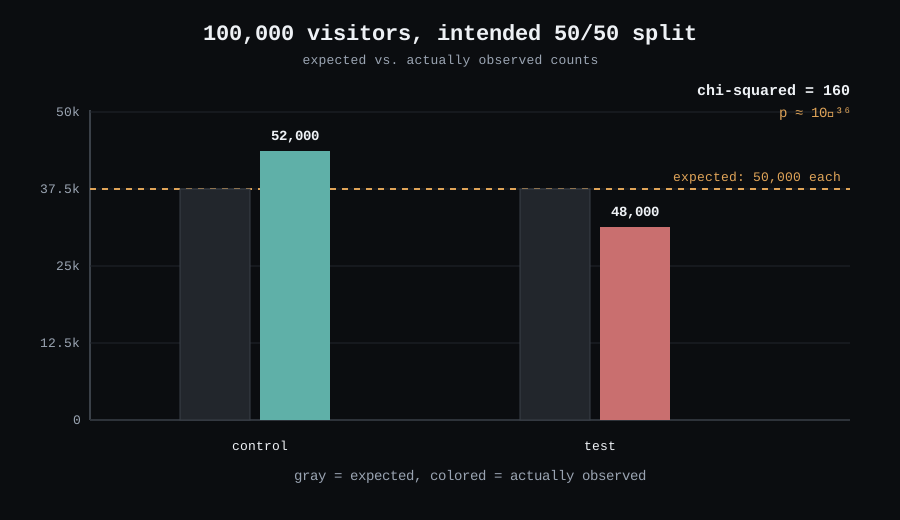
Run this check before you read any other result from the test. A significant SRM doesn’t tell you your product change failed, it tells you the comparison itself isn’t trustworthy, full stop - fix the split, don’t interpret the metric.
In plain words: a teacher splits 100 kids into two identical classrooms by coin flip, expecting roughly 50 and 50. If 62 end up in room A and 38 in room B, you don’t go looking for what’s different about the kids in room A - you go check the coin.
[ SIMPSON’S PARADOX ]
Simpson's Paradox - the aggregate result shows B beating A, but every individual segment shows A beating B. The overall number and the segment-level numbers are both correct; they just tell opposite stories, because something is unevenly distributed between the two.
The textbook real-world case is a 1986 study of 700 kidney stone patients comparing two treatments. Overall, Treatment B (a less invasive procedure) had a better success rate than Treatment A, 83% against 78%. But split the same patients by stone size, and Treatment A wins in both the small-stone group and the large-stone group. What happened: doctors preferentially gave the gentler Treatment B to patients with smaller stones, who were easier cases to begin with regardless of treatment. Size was doing the real work; treatment assignment was riding along on top of it.
That case is a selection-bias story, not a randomization bug - nobody split anything wrong, doctors were just choosing based on severity. In an actual A/B test, where assignment is supposed to be random, the same pattern showing up is a stronger signal: something correlated with the outcome ended up unevenly split between your two groups. Check segment-level performance after any test that looks clean in aggregate - by platform, region, new vs. returning, whatever you track - and if every segment disagrees with the topline number, suspect the split before you trust the topline.
In plain words: two delivery drivers. Driver A is faster than Driver B on short routes, and faster than Driver B on long routes too. But overall, across the month, Driver B has the better average time - because Driver B mostly got assigned short routes, and Driver A got stuck with the long ones. Add it all up and the assignment is doing the work, not the driving.
[ OTHER CHECKS WORTH RUNNING ]
A few more from the same family, lower ceremony than the three above but worth having in the rotation:
- Guardrail metrics - track a small set of core health metrics (page load time, crash rate, unsubscribe rate) on every test regardless of what it’s meant to measure, so a change that “wins” on its target metric while quietly breaking something else gets caught immediately. Example: a checkout redesign lifts conversion 3%, but the page-load guardrail shows +400ms - that’s not a false alarm, that’s the guardrail doing exactly its job.
- Multiple-comparison correction - the more metrics or segments you check on a single test, the more of those checks will clear a 5% bar by chance alone. If you’re tracking a dashboard of twenty metrics per test, expect roughly one of them to look “significant” for no real reason - correct your threshold (Bonferroni or similar) or treat any single metric flagged out of a large batch skeptically until it replicates. Example: scroll depth alone spikes to p=0.03 out of twenty tracked metrics where nothing else moved - that’s the base rate you’d expect from chance, not a discovery.
- Pre-launch bias check - before a test goes live, run the intended split for a short window with no actual treatment applied yet (an A/A period baked into the same pipeline) and confirm it comes back clean. Catches the same class of bug as a standing A/A test, just gated in front of the specific experiment instead of running generally. Example: a 48-hour blank dry run on a pricing test’s exact split logic, confirming both arms convert identically before the real price difference goes live.
[ THE CHECKLIST ]
| Check | Catches | Run it |
|---|---|---|
| A/A test | Tracking, randomization, pipeline bugs | Continuously, on idle traffic |
| SRM (chi-squared) | Broken splitter, bot traffic, ID leaks | Before reading any other result |
| Segment breakdown | Simpson's Paradox, hidden confounds | After any "clean" result |
| Guardrail metrics | A win that breaks something else | On every test, by default |
| Multiple-comparison correction | False positives from dashboard-scanning | Whenever you track many metrics per test |
A statistically significant result off a broken pipeline is just a precise measurement of the wrong thing. These checks are cheap relative to what they protect against - run them before you trust the number, not after someone’s already acted on it.
[ ELSEWHERE ]
GitHub · LinkedIn · Dev.to · Substack · 4thwithme.dev/blog
May the --force be with you. See you next week.