4. A/B testing: when the standard test is the wrong tool
Last week was the standard fixed-horizon test: split traffic 50/50, wait for your pre-calculated sample size, look once, done. That’s still the right default most of the time. It’s not the only tool, though, and treating it as the only one gets expensive once its assumptions stop matching your situation.
[ WHY THE DEFAULT ISN’T ALWAYS RIGHT ]
A fixed-horizon test answers one question: is there a detectable difference between two fixed groups, at a preset error tolerance, once enough data has come in. That’s the whole job. It doesn’t answer “how do I make the most money while this test runs,” and it assumes your two groups don’t affect each other. Both assumptions can quietly fail.
Here’s a real version of why that matters. A subscription business earning roughly $1M a month runs a pricing test: 10% baseline conversion, a 5-week horizon at the standard 5%/80% thresholds. One week in, the test group converts at 15% against the control’s 10% - a trend that, if it held, would add roughly $500K to that month’s revenue. The textbook says don’t stop, the sample size isn’t there yet.
That’s not a math problem, it’s the wrong question. The test was built to answer “is there a detectable difference at a fixed error rate,” not “how do I make the most money while this runs.” Point it at the second question and it keeps giving you the wrong kind of answer.
[ MULTI-ARMED BANDITS ]
Multi-armed bandit - instead of holding a fixed split for a fixed duration, you continuously shift more traffic toward whichever variant is currently winning, while still sending a smaller slice to the others so you don't lock in a lucky early read. The name comes from a gambler in front of a row of slot machines ("one-armed bandits"), trying to find the one that pays out best while losing as little as possible to the rest.
That tension has a name: the exploration-exploitation tradeoff. Exploit too early and you lock in the wrong winner off a noisy first week; explore forever and you never cash in on knowing which one wins. Studied by Allied scientists in World War II, and found so hard that mathematician Peter Whittle joked it should be dropped over Germany so enemy scientists could waste their time on it too, before Herbert Robbins gave it a serious mathematical treatment in 1952. Three practical strategies still run in production today: epsilon-greedy (mostly exploit, explore at random sometimes), UCB (favor whatever you’re least certain about), and Thompson sampling (a Bayesian approach that updates its belief as data comes in).
Run as a bandit, the pricing test above looks different: most traffic goes to whichever price is winning, a smaller slice keeps testing the alternative, and the split keeps moving as the picture updates, instead of freezing at 50/50 for five weeks.
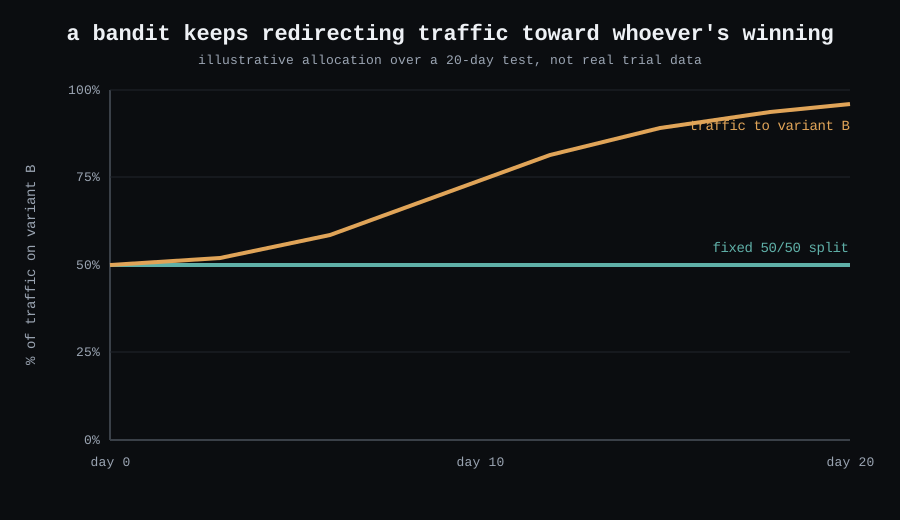
The trade-off: a bandit chases money made during the test, not a clean significance result, and usually needs longer to reach the same confidence one calculated sample size gets you. Use it when running a worse variant a little longer costs more than a tidy p-value is worth.
Three ice cream stands, and you want to know which one people like best. A regular test sends exactly one-third of people to each stand for a whole month, even once it's obvious stand #2 is winning. A bandit is smarter: it quietly sends more people to stand #2, while still sending a few to the others, just in case they get better later.
[ SWITCHBACK TESTS ]
Switchback test - instead of splitting your population into two groups, split time into blocks and alternate the whole population between A and B as blocks pass: this hour everyone gets A, next hour everyone gets B, on a randomized schedule.
The case for this shows up once your users stop being independent of each other. A standard split assumes what happens to user A doesn’t leak into user B’s experience. That breaks in a marketplace: if half of riders see one price and half see another, drivers respond to whichever price is in front of them, and both groups end up competing for the same pool of drivers. The “control” group is now polluted by the treatment group’s effect on shared supply. Alternating the whole market by time block avoids that: “this city under A” versus “the same city under B,” not two artificially split groups sharing the same supply.
There’s no single textbook citation for this the way “multi-armed bandit” has one; the closest formal relative is what statisticians call crossover design, adapted for markets instead of individual subjects. Uber and Lyft have both published on using it for dynamic-pricing and dispatch experiments, exactly because their two-sided marketplaces make a standard user-level split unreliable.
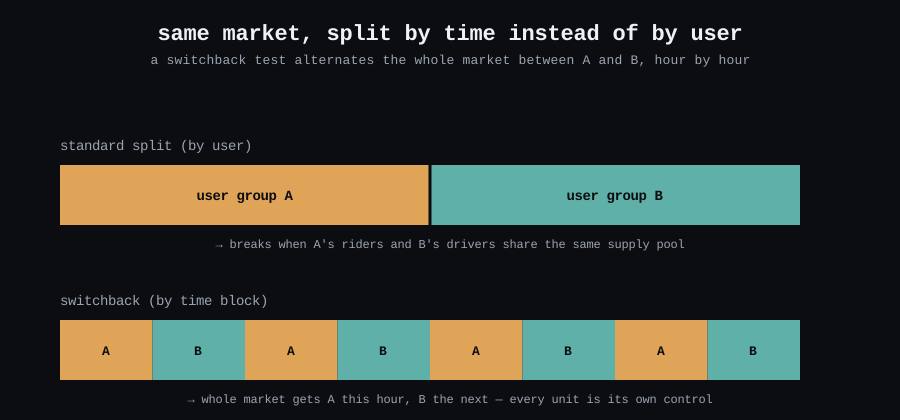
One playground, one set of kids. You can't fairly split them "half get the red slide, half get the blue slide," because they all play together and one group's fun affects the other's. So instead: everyone gets red on Monday, blue on Tuesday, red again on Wednesday - same kids, same playground, just switching what they try on different days.
[ HOLD-OUT TESTS ]
A hold-out test is the simplest design here: keep a slice of your population permanently untouched by the change, and compare how their behavior evolves against everyone else’s over time. No alternating, no traffic-shifting, just a group frozen in the “before” state as a long-running reference point. It earns its place for effects a short test can’t see - trust, habit, long-term retention - anything that shows up as a slow drift over months, not a clean signal within weeks. The cost: you’re deliberately holding back a possibly-better experience from real people, for a long time, just to keep a clean comparison available later.
A real one: Uber’s rider-acquisition team saw wild week-to-week swings in Meta ad cost-per-acquisition that looked more like noise than signal, so they ran a 3-month hold-out - just turned Meta ads off for a slice of the market and watched. Nothing happened. Signups held steady, meaning the ads were just taking credit for people who’d have signed up anyway. That freed up roughly $35M a year for channels that actually moved the number - a finding a two-week test would never have had the runway to catch.
[ PRE/POST & SYNTHETIC CONTROL ]
Sometimes there’s no way to randomize at all, because there’s only one of you: one product launching a redesign, one market entering a new pricing policy. You can’t hold half a country in a control group. The blunt option is a pre/post comparison - metric before, metric after, call the difference the effect. It’s also the weakest design here: everything else moving in that window (seasonality, a competitor’s move, the economy) gets mixed into your “effect” with no way to pull it back out.
Synthetic control - when you have exactly one treated unit and no real control group, build a fake one: a weighted blend of other similar untreated units, chosen so the blend tracks your unit's trend closely before the change. After the change, the gap between what actually happened and what the blend predicts is your estimated effect.
This isn’t an internet-testing invention, it comes from economics. Alberto Abadie and Javier Gardeazabal introduced it in 2003, building a “synthetic Basque Country” out of a blend of other Spanish regions to estimate what its economy would have done without a decades-long conflict. The method’s Wikipedia page is a good primer; the idea carries over cleanly to product work, where “other regions” become other markets, stores, or cohorts that never saw your change.
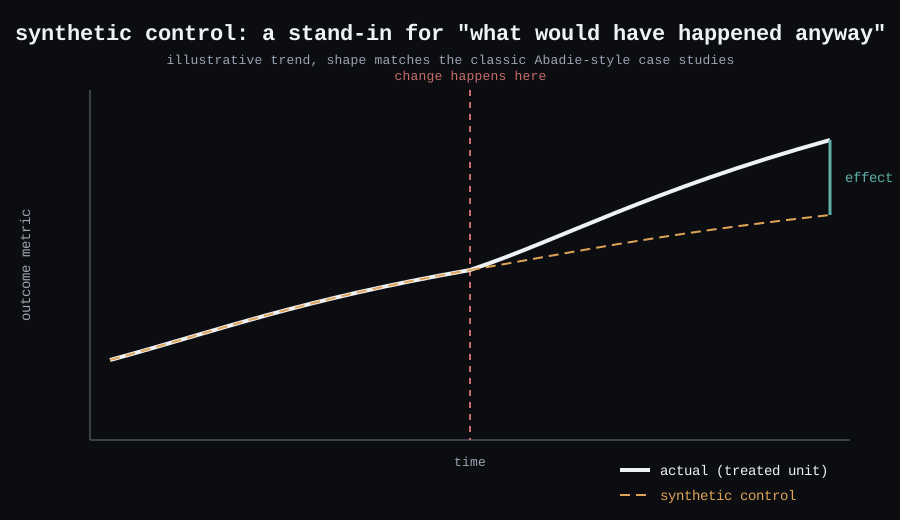
One plant, and you want to know if a new fertilizer helped it grow. No second identical plant to compare against. So you blend ten other, similar-but-not-identical plants into one imaginary "average plant" that grew just like yours did before the fertilizer. If your real plant suddenly grows taller than that imaginary one, the gap is probably the fertilizer.
[ DON’T REACH FOR A/B/C/D EARLY ]
Testing four or five variants at once is tempting when you have a backlog and want an answer fast. Resist it. A clean multi-variant test needs roughly the same sample size as a sequence of pairwise tests, but it’s far harder to tell which comparison drove the result, and far easier to p-hack yourself by checking every pair until one clears the bar. A sequence costs calendar time, not data, and buys back your ability to actually interpret what happened.
[ HOW TO ACTUALLY CHOOSE ]
No universal method fits every situation - last week’s flow solves one problem, nothing beyond that. You’ll hit other limits too: overlapping tests, insufficient traffic, a goal about maximizing an outcome instead of detecting a difference. A rough guide:
| Your situation | Reach for |
|---|---|
| Can randomize independently, want a calibrated error rate | Standard fixed-horizon A/B test |
| Users interact with each other (marketplace, shared supply) | Switchback test |
| Goal is maximizing outcome during the test, not a calibrated verdict | Multi-armed bandit |
| Only one treated unit exists, no randomization possible | Pre/post, ideally with synthetic control |
| Effect is slow, long-term, or compounding | Hold-out test |
| More than two variants on the table | Decompose into a sequence of A/B tests |
None of these replace the fixed-horizon test as a default. Reach for them once you can name the specific way your situation breaks its assumptions - not before.
[ ELSEWHERE ]
GitHub · LinkedIn · Dev.to · Substack · 4thwithme.dev/blog
May the --force be with you. See you next week.